Fil:Arctic Sea Ice Minimum Comparison.png

Opprinnelig fil (720 × 1 005 piksler, filstørrelse: 226 KB, MIME-type: image/png)
Beskrivelse
| Beskrivelse |
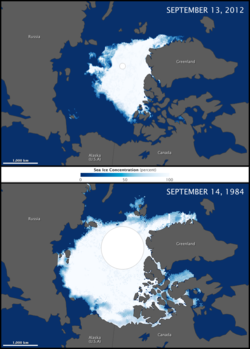
English: Arctic sea ice grows through the winter each year and melts through the summer, typically reaching its minimum extent sometime in September. The extent can vary considerably from year to year, sometimes above the long-term average and sometimes below. Extent is defined as the total area in which the ice concentration is at least 15 percent.
The maps above compare the Arctic ice minimum extents from 2012 (top) and 1984 (bottom). According to NSIDC, the average minimum extent for 1979–2000 was 6.70 million square kilometers (2.59 million square miles). The 1984 minimum was roughly that amount, so a comparison between 2012 and 1984 gives an idea of how much conditions this year strayed from the long-term average. The minimum ice extent in 2012 was about half the average. The 2012 map was compiled from observations by the Advanced Microwave Scanning Radiometer 2 (AMSR-2) sensor on the Global Change Observation Mission 1st–Water (“Shizuku”) satellite, which is operated by the Japan Aerospace Exploration Agency (JAXA). As of September, AMSR-2 data were still preliminary, as the mission was launched in May 2012 and instruments are still being fully calibrated and validated. But the data agreed with observations from the Special Sensor Microwave Imager/Sounder (SSMIS) from the U.S. Defense Meteorological Satellite Program. The 1984 image was made from observations by the Scanning Multichannel Microwave Radiometer (SMMR) on the Nimbus-7 satellite. Sea ice in the 1984 image has a blockier appearance because that sensor had coarser resolution. The white circle over the pole in each image is a data gap resulting from satellites flying close to—but not directly over—the poles. The wider orbital coverage by AMSR-2 (and other satellite instruments) has shrunk the size of this gap. The area around the North Pole is ice-covered—an assumption confirmed by many airborne and ice-surface expeditions—but researchers use an average of the concentration just outside the gap to estimate the extent within. Caption by Michon Scott and Mike Carlowicz. |
| Dato | |
| Kilde | http://earthobservatory.nasa.gov/IOTD/view.php?id=79256 |
| Opphavsperson | Assembled from NASA Earth Observatory images by Jesse Allen, using data from the Advanced Microwave Scanning Radiometer 2 AMSR-2 sensor on the Global Change Observation Mission 1st-Water (GCOM-W1) satellite. |
Lisensiering
| This file is in the public domain in the United States because it was solely created by NASA. NASA copyright policy states that "NASA material is not protected by copyright unless noted". (See Template:PD-USGov, NASA copyright policy page or JPL Image Use Policy.) | ||
 |
Warnings:
|
Filhistorikk
Klikk på et tidspunkt for å vise filen slik den var på det tidspunktet.
| Dato/klokkeslett | Miniatyrbilde | Dimensjoner | Bruker | Kommentar | |
|---|---|---|---|---|---|
| nåværende | 24. nov. 2012 kl. 08:18 | | 720 × 1 005 (226 KB) | wikimediacommons>Sagredo | fixed the spacing and borders |
Filbruk
Den følgende siden bruker denne filen: